Continuous Intelligence: More Signal, Less Noise

Since childhood, Thomas has prioritized and emphasized human service and has always had a genuine passion for technology. Thomas is adept at recognizing and personally investing in open source market-leading platforms. He uses his insight and genuine desire for service to help his customers with their most difficult continuous delivery problems.
This blog was originally published on May 11, 2016 on the CloudBees blog. here.
This is the seventh blog in the Field Notes from a DevOps Cultural Anthropologist series. This blog deals with the monitoring, the M in CAMS (Culture, Automation, Monitoring and Sharing). Monitoring is incredibly important to any DevOps organization. Good, efficient monitoring is elusive. There is a need to move from IT monitoring to continuous intelligence. The continuous intelligence of a software development and delivery lifecycle could take the form of a “pocket NOC”, a real-time, heads-up display of information on the state of the systems, the development and the delivery of a software product. I have been in the continuous delivery and DevOps industry for nine years and have made a number of observations during that time. I have seen strategies succeed – and fail. My goal is to try to help you be one of the successes! I’d love to hear your comments and experiences with continuous delivery and DevOps.
Big Panda recently published The State of Monitoring 2016, which was a survey on monitoring, distributed to 1700+ industry professionals. They said, “in 2016, system performance and availability have a more direct and critical impact on reputation and brand loyalty than ever before. Perhaps it’s not surprising that the performance of IT teams is increasingly measured against the results of the business, with customer satisfaction and SLA compliance taking the lead over ‘traditional’ performance metrics like incident volumes and mean time to repair (MTTR)”[1] .
Big Panda found the top 5 monitoring challenges to be:
83% report difficulty quickly remediating service disruptions
79% report difficulty reducing alert noise from organization’s monitoring tools
78% report difficulty securing budget for the proper monitoring tools
76% report difficulty quickly identifying service disruptions
75% report difficulty migrating services to the cloud
They further report that the most anticipated IT monitoring challenges of 2016 are:
Scaling monitoring with growth
Improving monitoring strategy
Alert correlation or noise reduction
Maintaining SLAs or other performance KPIs
Cloud migration
Gene Kim’s Three Ways are principles that can be leveraged to deal with monitoring’s most difficult challenges. The Three Ways are:
The First Way: Systems Thinking - Focus is on the performance of the entire system, on all business value streams that are enabled by IT.
The Second Way: Amplify Feedback Loops - Emphasis is on increasing feedback and understanding of all teams involved. The outcomes of this will be increased communication and response to all customers, internal and external, shortening and amplifying all feedback loops, and embedding knowledge where and to whom it is needed.
The Third Way: Culture of Continual Experimentation and Learning - Embedding experimentation and practice in the working culture. Learning from risks and repetition and practice are encouraged – and is key to controllery. Risk taking and experimentation promote improvement, whilst controllery provides the skills required to revert any mistakes. [2]
Applying Gene Kim’s First Way of systems thinking requires looking at the complete DevOps toolchain and deciding what to monitor and extract intelligence on. The DevOps toolchain according to Wikipedia is as follows:[3]
Code – Code development and review, continuous integration tools
Build – Version control tools, code merging, build status
Test – Test and results determine performance
Package – Artifact repository , application pre-deployment staging
Release – Change management, release approvals, release automation
Configure – Infrastructure configuration and management, Infrastructure as Code tools
Monitor – Applications performance monitoring , end user experience
Once armed with thoughtful systems knowledge, the Second Way can be tackled. This step is the actual monitoring, alerting and logging step. The results of the analysis of the First Way provides the feedback touchpoints for the monitoring system. It is the answers to the who, what, when, why, where and how questions. It is the step where the system itself starts to express intelligence about itself. This intelligence can become continuous if it is distilled and made into actionable information. Continuous intelligence can provide a “pocket NOC” of nine actionable monitoring items that fit on a smartphone screen. Examples of the nine important metrics that would fit on a manager’s pocket NOC are:
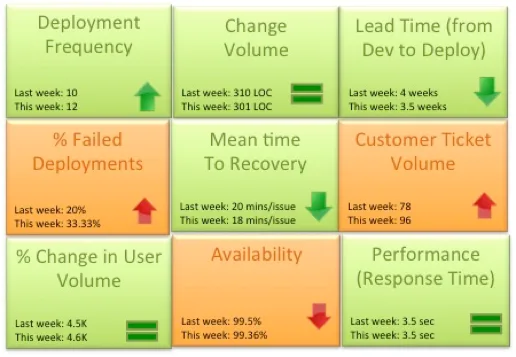
Deployment frequency : How often is code deployed and how often is it getting into the hands of customers? This metric should trend up or remain stable from week to week. Example: Twice a week, 50 times a day.
Change volume : For each deployment, how many user stories and new lines of code are making it to production? Example: 3 new features per day, Average 500 lines of new code per week. Another parameter to consider in addition to volume is complexity of change.
Lead Time (from Dev to Deploy) : How long does it take on average to get the code from development completely through a cycle of A/B testing to 100% deployed and upgraded on production? Lead time should reduce as the team gets a better hold of the lifecycle.
Percentage of failed deployments : What percentage of deployments failed, causing an outage or a negative user reaction? This metric should decrease over time. Example: 9% deployments failed this month as opposed to 15% last month. This metric should be reviewed in combination with the change volume. If the change volume is low or remained the same but the percent of failed deployments increased, then there may be a dysfunction somewhere.
Mean time to recovery: When we did fail, how long did it take us to recover? This is a true indicator of how good you are getting with handling change and this should ideally reduce over time. You can expect some spikes in this number due to complex issues not encountered before. Example: On average it took the team 15 minutes to resolve each last week, 14 minutes this week.
Customer Ticket Volume : Number of alerts generated by customers to indicate issues in the service. This is a basic indicator of customer satisfaction. Example: 54 tickets generated this week as opposed to 38 while the user volume remained steady is not a good thing.
% Change in User Volume : Number of new users signing up, interacting with the service and generating traffic. As new users sign up, is my infrastructure able to handle the demand? Example: This week the number of customers spiked by 30% due to an external event causing volume of requests to go up.
Availability : What is the overall uptime for the service and did I violate any SLAs? Example: 99.9% uptime consistently for the last 3 months even with change in user volume.
Performance (Response Time) : Is my service performing within my predetermined thresholds? This metric should remain stable irrespective of % change in user volume or any new deployment. Example: Sub 5 second response time from all geographies and devices.[4]
We’ll stop at the Second Way as this is a blog article about monitoring. Gene Kim’s Third Way, creating a culture of continual experimentation and learning will be a future blog article unto itself.
Thomas McGonagle Senior DevOps Consultant, Global Services CloudBees